Metadata-Driven Data Architecture- Leveraging draw.io and VSCode for Scalable Design
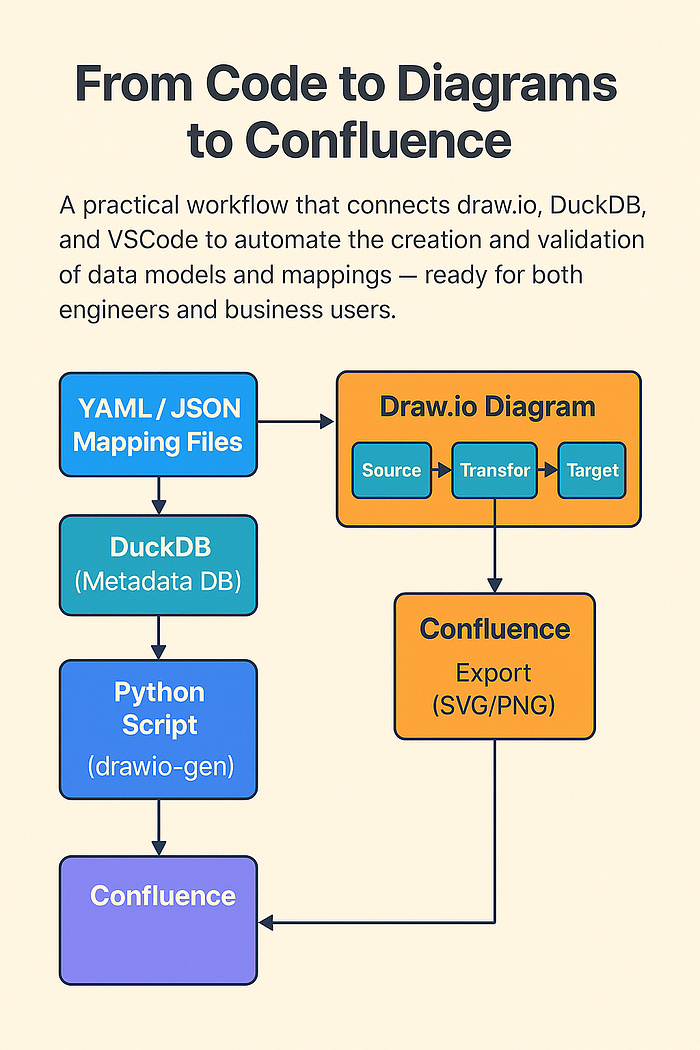
A practical workflow that connects draw.io, DuckDB, and VSCode to automate the creation and validation of data models and mappings — ready for both engineers and business users.
Summary
✅ Use code (YAML/JSON) as the single source of truth> 🔄 Generate consistent draw.io diagrams from metadata> 🔍 Parse diagrams back into metadata when needed ⚙️ Maintain and validate mappings in VSCode 📤 Automatically publish diagrams to Confluence
💡 Designed for teams that want visual clarity with code-based control
Part 1: Why Metadata-Driven Design Needs Visual & Text-Based Harmony
In a modern data architecture, metadata is the glue that connects business understanding to technical implementation. However, visualizing and managing this metadata at scale remains a challenge.
This series proposes a robust, scriptable workflow combining draw.io and Visual Studio Code (VSCode) to deliver clear, version-controlled, and business-friendly data models.
Our goal: use diagrams as a view, not as the source of truth. All diagrams are generated from metadata and can be parsed back to metadata when necessary.
Part 2: Generating draw.io Diagrams from Metadata
We automatically generate draw.io diagrams (ERDs and Mapping Diagrams) using metadata stored in DuckDB. These diagrams:
- Reflect relationships, transformations, and logical data flow
- Are organized as separate
.drawiofiles or pages within a multi-page file - Are consistent in layout, styling, and component naming
Using Python scripts, we read metadata (e.g., relationships, transformations) and create draw.io XML structures, saving them as .drawio files.
Part 3: Parsing draw.io Back into Metadata
Our workflow allows diagrams to be parsed back into structured metadata:
- Extract nodes, labels, positions, and relationships from the
.drawioXML - Update DuckDB metadata tables with business-friendly annotations
- Track changes or enrich existing mappings
Although not the primary update mechanism, this feature is useful for:
- Early conceptual design sessions
- Business stakeholder input
- Diagram reverse engineering
Part 4: Organizing Diagrams and Code in VSCode
We use the Draw.io Integration plugin for VSCode to:
- Visually open and edit
.drawiodiagrams - Organize diagrams alongside mapping files
- Enable clickable navigation: from diagram components to YAML/JSON or SQL files
All components are stored in a Git repository, allowing version control, collaboration, and pull request reviews.
Example file structure:
/data-models
  /mappings
    orders_to_dwh.yaml
  /diagrams
    orders_mapping.drawio
  /sql
    orders_to_dwh.sql
Part 5: Maintaining Mappings in Code, Not in Diagrams
We strongly prefer maintaining mappings in structured text formats:
- YAML or JSON files define the data flow, transformations, filters, joins
- These are validated using schemas, VSCode extensions, or custom Python scripts
- GitHub Copilot can assist in authoring these files
Benefits:
- Easier diffs, reviews, and traceability
- Fully scriptable and testable
- Enables code-driven diagram generation
Tools and Extensions:
- YAML Language Server
- JSON Schema validator
- GitHub Copilot
- Custom linters/validators
Part 6: Automated Diagram Generation Pipeline
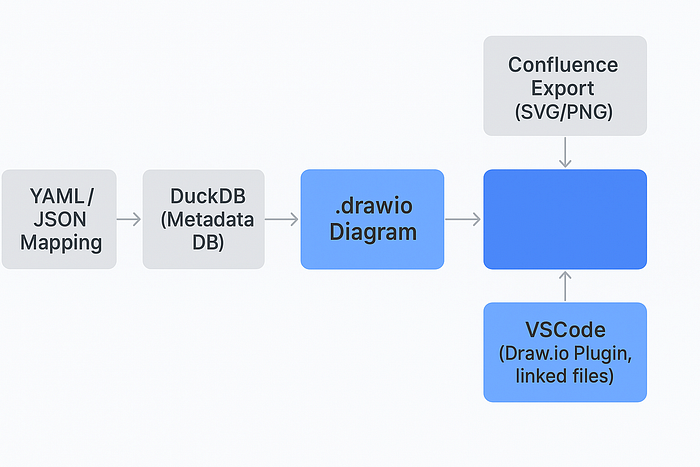
YAML Mapping → Metadata DB → Python Script → draw.io XML → .drawio File
By maintaining a code-first approach, we ensure:
- Consistent layout and style across diagrams
- Reusable diagram components (functions, filters, joins)
- Easy regeneration after metadata updates
Scripts also handle component positioning, grouping, and color coding.
Part 7: Publishing to Confluence
Draw.io files can be exported as SVG/PNG and embedded into Confluence pages:
- Python or CI pipelines can automate export
- Markdown or HTML descriptions accompany diagrams
- Business users get accessible, versioned views of metadata and mappings
This bridges the gap between technical metadata and business communication.
Summary Workflow Diagram
Next Steps
In future articles, we’ll provide:
- Sample Python scripts for draw.io generation and parsing
- YAML schema examples for mappings
- VSCode setup and plugin configuration
- Real-world use cases and templates for re-use
Let diagrams be a view of the system — not the bottleneck in your metadata lifecycle.