Generate consistent, scalable draw.io diagrams from YAML or DuckDB metadata using Python — and maintain your data architecture with code, not clicks.
Part 2: Diagram Generation Pipeline
In this article, we dive into the heart of the automation process: how we generate draw.io diagrams automatically from structured metadata — using Python, DuckDB, and a declarative code-first approach.
This method ensures that diagrams are always consistent, versioned, and up-to-date, aligning with business logic and technical design.

🧠 Why Generate Diagrams from Metadata?
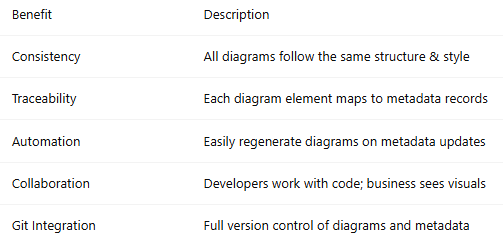
Manually creating diagrams in draw.io becomes unmanageable as systems grow. Diagrams get out of sync with mappings, styles vary by author, and traceability is lost. By using code as the single source of truth, we:
- Reduce manual work
- Enforce visual and structural consistency
- Enable regeneration on metadata change
- Version-control every element in Git
- Avoid relying on the draw.io editor for mapping maintenance
⚙️ Architecture Overview
Here’s the high-level flow:
YAML Mapping → Metadata Tables in DuckDB → Python Script → draw.io XML → .drawio File
We use a dedicated Python module (e.g. drawio_gen) to:
- Read metadata from DuckDB or YAML
- Map entities, relationships, and transformations to draw.io components
- Apply layout logic, styles, and templates
- Export the result as a
.drawiofile
🛠️ Python Script Example (Simplified)
import duckdb
import xml.etree.ElementTree as ET
def fetch_metadata():
con = duckdb.connect('metadata.duckdb')
return con.execute("SELECT * FROM mappings").fetchall()
def create_drawio_xml(metadata):
diagram = ET.Element('diagram')
for row in metadata:
shape = ET.SubElement(diagram, 'mxCell', {
'id': row["id"],
'value': row["label"],
'style': 'shape=rectangle;fillColor=#dae8fc;',
'vertex': '1',
'parent': '1'
})
geometry = ET.SubElement(shape, 'mxGeometry', {
'x': str(row['x']),
'y': str(row['y']),
'width': '120',
'height': '40',
'as': 'geometry'
})
return ET.tostring(diagram, encoding='unicode')
metadata = fetch_metadata()
diagram_xml = create_drawio_xml(metadata)
with open('output.drawio', 'w') as f:
f.write(diagram_xml)
🧱 Metadata Table Structure
The minimum required metadata:
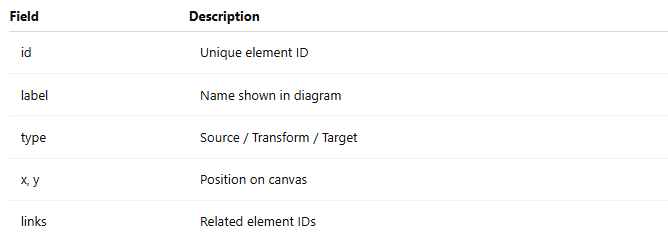
This can be expanded to include:
- Styling presets
- Component categories
- Grouping / layering
- Metadata links for tooltips
🎨 Styling and Templates
To make diagrams clean and easy to read:
- Use consistent color-coding (e.g., blue for sources, green for targets)
- Apply layering rules (e.g., sources on the left, targets on the right)
- Reuse component libraries for logical constructs
Example Style Map
STYLE_MAP = {
'source': 'shape=ellipse;fillColor=#cce5ff;',
'transform': 'shape=hexagon;fillColor=#e6ffe6;',
'target': 'shape=rectangle;fillColor=#ffd9b3;',
}
📤 Output Format: .drawio
The final output is an XML file following the draw.io format. This file can be:
- Opened directly in draw.io or the VSCode plugin
- Versioned alongside mappings in Git
- Exported as SVG/PNG via script or CI/CD
This approach ensures that the diagram is a living reflection of the metadata.
📈 Advantages Recap