Rule-based measure creation that scales
From Entity to Measure: Automated DAX Generation
Rule-based measure creation that scales
Every Power BI semantic model needs measures. Total Sales. Average Order Value. Year-over-Year Growth. Count of Customers.
Most teams write these by hand. Every. Single. Time.
But measures follow patterns. If you can describe the pattern, you can generate the measure. This article shows how model-driven data engineering transforms entity definitions into complete DAX measures — automatically.

The Measure Explosion Problem
Consider a simple entity: Sales with one numeric attribute: Amount.
From this single attribute, business users need:
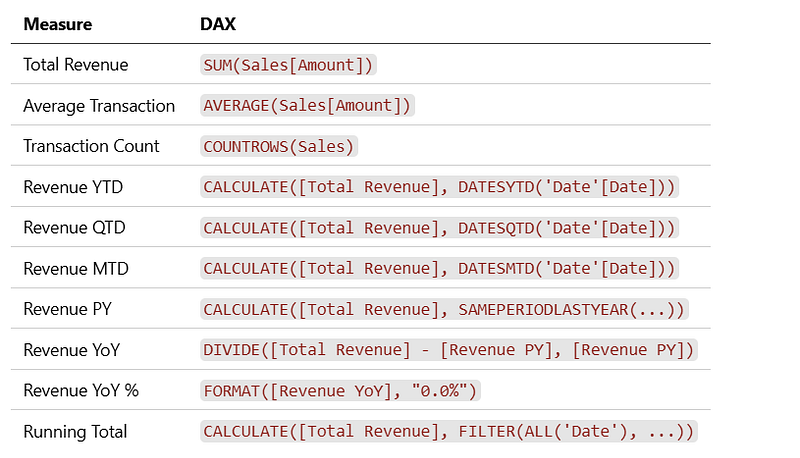
That’s 10 measures from one attribute. A typical model has 20–50 numeric attributes. Do the math.
Writing these by hand is:
- Slow — Hours of repetitive work
- Error-prone — Typos, inconsistent naming, wrong date tables
- Unmaintainable — Rename an attribute, update 50 measures
The Pattern Recognition
Look at those measures again. They follow templates:
Aggregation Patterns
SUM([{attribute}])
AVERAGE([{attribute}])
MIN([{attribute}])
MAX([{attribute}])
COUNTROWS({table})
DISTINCTCOUNT([{attribute}])
Time Intelligence Patterns
CALCULATE([{base_measure}], DATESYTD('{date_table}'[{date_column}]))
CALCULATE([{base_measure}], DATESQTD('{date_table}'[{date_column}]))
CALCULATE([{base_measure}], DATESMTD('{date_table}'[{date_column}]))
CALCULATE([{base_measure}], SAMEPERIODLASTYEAR('{date_table}'[{date_column}]))
Comparison Patterns
[{base_measure}] - [{comparison_measure}]
DIVIDE([{base_measure}] - [{comparison_measure}], [{comparison_measure}])
If measures follow patterns, we can generate them from rules.
The MDDE Approach
Step 1: Define the Entity
# entities/sales.yaml
entities:
  - name: Sales
    stereotype: dim_fact
    description: "Customer sales transactions"

date_role: OrderDate  # Which column links to date dimension
    attributes:
      - name: OrderDate
        type: date
        role: date_key
        references: Date.DateKey
      - name: Amount
        type: decimal(18,2)
        description: "Net transaction amount"
        semantic_type: currency
        aggregations: [sum, average]  # Which aggregations to generate
      - name: Quantity
        type: int
        description: "Number of units sold"
        aggregations: [sum]
      - name: CustomerID
        type: int
        references: Customer.CustomerID
        aggregations: [distinctcount]  # Count unique customers
Step 2: Define Measure Templates
# templates/time_intelligence.yaml
templates:
  - name: YTD
    suffix: " YTD"
    expression: |
      CALCULATE(
          [{base_measure}],
          DATESYTD('{date_table}'[{date_column}])
      )
    description_prefix: "Year-to-date:"

- name: QTD
    suffix: " QTD"
    expression: |
      CALCULATE(
          [{base_measure}],
          DATESQTD('{date_table}'[{date_column}])
      )
    description_prefix: "Quarter-to-date:"
  - name: PY
    suffix: " PY"
    expression: |
      CALCULATE(
          [{base_measure}],
          SAMEPERIODLASTYEAR('{date_table}'[{date_column}])
      )
    description_prefix: "Prior year:"
  - name: YoY
    suffix: " YoY"
    expression: |
      VAR CurrentValue = [{base_measure}]
      VAR PriorValue = [{base_measure} PY]
      RETURN
          DIVIDE(
              CurrentValue - PriorValue,
              PriorValue
          )
    description_prefix: "Year-over-year change:"
    format: percent
    requires: [PY]  # Must generate PY first
Step 3: Generate Measures
mdde dax generate --entity Sales --output measures.tmdl
Generated output:
 // ============================================
// Auto-generated measures for entity: Sales
// Generated: 2026-03-07T14:30:00Z
// Source: entities/sales.yaml
// ============================================

// Base aggregations
measure 'Total Revenue' = SUM(Sales[Amount])
    formatString: \$#,0.00
    description: "Sum of net transaction amount"
measure 'Average Transaction' = AVERAGE(Sales[Amount])
    formatString: \$#,0.00
    description: "Average of net transaction amount"
measure 'Total Quantity' = SUM(Sales[Quantity])
    formatString: #,0
    description: "Sum of number of units sold"
measure 'Customer Count' = DISTINCTCOUNT(Sales[CustomerID])
    formatString: #,0
    description: "Count of unique customers"
// Time intelligence: Total Revenue
measure 'Total Revenue YTD' =
    CALCULATE(
        [Total Revenue],
        DATESYTD('Date'[Date])
    )
    formatString: \$#,0.00
    description: "Year-to-date: Sum of net transaction amount"
measure 'Total Revenue QTD' =
    CALCULATE(
        [Total Revenue],
        DATESQTD('Date'[Date])
    )
    formatString: \$#,0.00
    description: "Quarter-to-date: Sum of net transaction amount"
measure 'Total Revenue PY' =
    CALCULATE(
        [Total Revenue],
        SAMEPERIODLASTYEAR('Date'[Date])
    )
    formatString: \$#,0.00
    description: "Prior year: Sum of net transaction amount"
measure 'Total Revenue YoY' =
    VAR CurrentValue = [Total Revenue]
    VAR PriorValue = [Total Revenue PY]
    RETURN
        DIVIDE(
            CurrentValue - PriorValue,
            PriorValue
        )
    formatString: 0.0%
    description: "Year-over-year change: Sum of net transaction amount"
// Time intelligence: Total Quantity
measure 'Total Quantity YTD' =
    CALCULATE(
        [Total Quantity],
        DATESYTD('Date'[Date])
    )
    formatString: #,0
    description: "Year-to-date: Sum of number of units sold"
// ... (additional measures)
From 4 attribute definitions, we generated 16+ measures — all correctly named, formatted, and documented.
Rule Categories
Category 1: Base Aggregations

# rules/aggregations.yaml
aggregation_rules:
  - semantic_type: currency
    default: sum
    also_generate: [average]
    format: "$#,0.00"
  - semantic_type: quantity
    default: sum
    format: "#,0"
  - semantic_type: rate
    default: average
    format: "0.00%"
  - semantic_type: identifier
    default: distinctcount
    format: "#,0"
Category 2: Time Intelligence
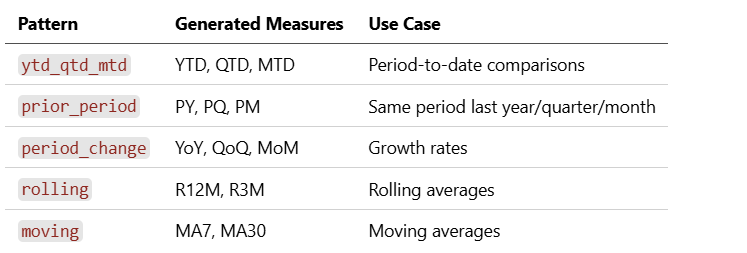
# rules/time_intelligence.yaml
time_intelligence:
  - name: ytd_qtd_mtd
    patterns: [YTD, QTD, MTD]
    applies_to: [currency, quantity]
  - name: prior_period
    patterns: [PY, PQ, PM]
    applies_to: [currency, quantity]
  - name: period_change
    patterns: [YoY, QoQ, MoM]
    applies_to: [currency, quantity]
    requires: prior_period
    format: percent
  - name: rolling
    patterns:
      - name: R12M
        months: 12
      - name: R3M
        months: 3
    applies_to: [currency]
Category 3: Ratios and Percentages
PatternGenerated MeasureExamplecontribution% of ParentProduct % of Category Salesshare% of TotalMarket SharemarginA / BGross Margin %conversionA / BConversion Rate
# rules/ratios.yaml
ratio_rules:
  - name: margin
    numerator: profit
    denominator: revenue
    format: percent
    template: |
      DIVIDE([{numerator}], [{denominator}])- name: contribution

    template: |
      DIVIDE(
          [{measure}],
          CALCULATE([{measure}], ALLSELECTED('{dimension}'))
      )
    format: percent
Category 4: Statistical
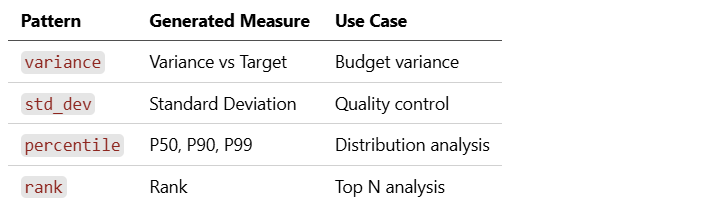
Smart Defaults
The generator infers sensible defaults from metadata:
Date Table Detection
# If entity has date_role, use it
entities:
  - name: Sales
    date_role: OrderDate  # Generator uses 'Date' table linked here
Format Inference
# Semantic type determines format
attributes:
  - name: Amount
    semantic_type: currency  # → "$#,0.00"

  - name: Rate
    semantic_type: percentage  # → "0.0%"

  - name: Count
    semantic_type: integer  # → "#,0"
Description Generation
# Descriptions compose from parts
measures:
  - name: Total Revenue
    # Description: "Sum of net transaction amount"
    # From: aggregation(sum) + attribute.description

  - name: Total Revenue YTD
    # Description: "Year-to-date: Sum of net transaction amount"
    # From: template.description_prefix + base_measure.description
Custom Measures
Not everything fits a template. Custom measures coexist with generated ones:
entities:
  - name: Sales
    attributes:
      - name: Amount
        aggregations: [sum]  # Generate standard measure

    measures:
      # Custom measure (passed through verbatim)
      - name: "Weighted Average Price"
        expression: |
          DIVIDE(
              SUMX(Sales, Sales[Amount] * Sales[Quantity]),
              SUM(Sales[Quantity])
          )
        description: "Revenue-weighted average unit price"

      # Reference generated measure in custom measure
      - name: "Revenue vs Target"
        expression: |
          [Total Revenue] - [Revenue Target]
        description: "Variance from target revenue"
CLI Commands
# Generate measures for one entity
mdde dax generate --entity Sales

# Generate for all entities
mdde dax generate --all

# Preview without writing files
mdde dax generate --entity Sales --dry-run

# Generate specific categories only
mdde dax generate --entity Sales --patterns time_intelligence,ratios

# Export as TMDL
mdde dax generate --entity Sales --format tmdl --output ./tmdl/

# Export as DAX script (for Tabular Editor)
mdde dax generate --entity Sales --format dax --output measures.dax
Validation
Generated measures are validated before output:
MEASURE GENERATION REPORT
=========================

Entity: Sales
Generated: 24 measures
Validation:
  ✓ All base measures reference valid columns
  ✓ Time intelligence measures reference valid date table
  ✓ Ratio denominators are non-null
  ✓ No circular references detected
  ✓ All formats are valid DAX format strings
Warnings:
  ⚠ Measure "Customer Count YTD" may perform poorly
    (DISTINCTCOUNT + time intelligence)
    Consider: Use approximate count or pre-aggregate
Generated successfully.
Integration with TMDL Export
Measure generation integrates with the full TMDL export pipeline:
# Generate complete semantic model
mdde export powerbi \
    --format tmdl \
    --output ./tmdl/ \
    --generate-measures \
    --time-intelligence ytd,py,yoy \
    --include-ratios
The exported TMDL includes:
- Tables from entity definitions
- Columns with proper data types
- Relationships from references
- Generated measures from rules
- Custom measures from metadata
- AI-ready properties (descriptions, synonyms)
Real-World Example
Input: E-commerce Entity Model
entities:
  - name: Orders
    stereotype: dim_fact
    date_role: OrderDate
    attributes:
      - name: OrderDate
        type: date
        role: date_key
      - name: Revenue
        type: decimal(18,2)
        semantic_type: currency
        aggregations: [sum, average]
      - name: Quantity
        type: int
        semantic_type: quantity
        aggregations: [sum]
      - name: Discount
        type: decimal(18,2)
        semantic_type: currency
        aggregations: [sum]
      - name: CustomerID
        type: int
        aggregations: [distinctcount]
      - name: OrderID
        type: int
        role: primary_key
        aggregations: [count]
    time_intelligence: [ytd, py, yoy]
    ratios:
      - name: Average Order Value
        expression: "[Total Revenue] / [Order Count]"
      - name: Discount Rate
        expression: "[Total Discount] / [Total Revenue]"
Output: 28 Generated Measures

28 measures from 6 attribute definitions. All correctly named, formatted, documented.
Key Takeaways
- Measures follow patterns — If you can describe the pattern, you can generate the measure.
- Semantic types drive defaults — Currency gets
$#,0.00, quantities get#,0, percentages get0.0%. - Time intelligence multiplies — One base measure generates YTD, QTD, MTD, PY, YoY variants automatically.
- Custom measures coexist — Templates for common patterns, custom DAX for unique logic.
- Validation catches errors — Invalid references, circular dependencies, performance issues flagged before deployment.
- Integration is seamless — Measure generation is part of the TMDL export pipeline.
Stop writing measures by hand. Define patterns, generate DAX, and focus on the business logic that actually requires human thought.
This is part of the Power BI + MDDE integration series.
Previous: “ MCP: The Universal Language for Data Tools ” Next: “ Copilot Optimization Checklist ”