How to generate interactive lineage and dependency maps from your metadata catalog
Summary
In the last article, we focused on metadata observability — detecting missing lineage, normalization gaps, and model drift using DuckDB.
Now we’ll make that insight visual.
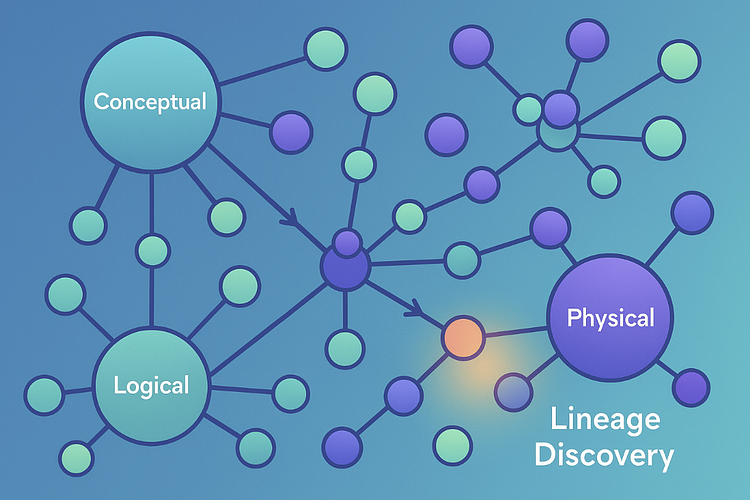
This article shows how to use your existing metadata catalog to generate interactive lineage graphs that connect conceptual, logical, and physical data models — helping everyone from analysts to architects understand how data flows through the system.
1. Why Visual Lineage Matters
Metadata becomes exponentially more valuable when you can see it.
A clear lineage visualization allows you to:
🧭 Navigate across layers (conceptual → logical → physical)
🧩 Understand dependencies between entities and attributes
🕵️ Detect modeling gaps or circular relationships
🚀 Communicate architecture clearly to non-technical stakeholders
Instead of static diagrams that quickly go out of date, we’ll generate lineage graphs dynamically — straight from metadata.
2. The Starting Point: Metadata in DuckDB
From previous articles, we now have our YAML-based models stored in a DuckDB catalog:
SELECT * FROM metadata.entities;
SELECT * FROM metadata.relationships;
Each row represents an entity or relationship, including lineage links like derived_from and conceptual_link. These relationships form the edges of our lineage graph.
3. Generating a Lineage Graph with Python
Here’s a small script that reads metadata from DuckDB and outputs a Mermaid or Graphviz diagram automatically.
import duckdb, pathlib
def build_lineage_graph(db_path=”data/metadata_catalog.duckdb”, output=”docs/lineage.mmd”):
conn = duckdb.connect(db_path)
edges = conn.execute(“”“
SELECT e.entity AS source, r.target AS target, r.type AS relation
FROM metadata.entities e
JOIN metadata.relationships r ON e.entity = r.entity
“”“).fetchall()
lines = [“graph TD”]
for s, t, rel in edges:
arrow = “–>” if rel in (“1:M”, “M:1”) else “—“
lines.append(f” {s} {arrow} {t}”)
pathlib.Path(output).write_text(“\n”.join(lines))
print(f”✅ Lineage diagram written to {output}”)
build_lineage_graph()
Output (Mermaid syntax):
graph TD
Customer –> Order
Order –> OrderLine
OrderLine –> Product
Paste this snippet into Markdown or Notion and it renders automatically as an interactive lineage graph.
4. Visualizing Lineage with pyvis (Interactive HTML)
If you want something more dynamic, use pyvis to create a zoomable HTML graph.
from pyvis.network import Network
import duckdb
net = Network(height=”700px”, width=”100%”, directed=True)
conn = duckdb.connect(“data/metadata_catalog.duckdb”)
for row in conn.execute(“SELECT entity, layer FROM metadata.entities”).fetchall():
net.add_node(row[0], label=row[0], group=row[1])
for s, t, rel in conn.execute(“SELECT entity, target, type FROM metadata.relationships”).fetchall():
net.add_edge(s, t, title=rel)
net.show(“docs/metadata_lineage.html”)
The result:
An interactive lineage graph with color-coded layers — conceptual, logical, physical — and tooltips showing relationships.
5. Layer-Based Color Coding
You can make each layer visually distinct:

When rendered in pyvis or D3.js, this gives you a three-layer lineage view.
Hovering over an entity highlights its ancestors and descendants — bringing the metadata hierarchy to life.
6. Linking Lineage to Documentation
Because each entity in your metadata already has a Notion or Confluence page, you can add URLs as node metadata:
net.add_node(row[0], label=row[0], group=row[1],
title=f”View in Notion“)
Now, clicking a node opens the corresponding documentation page — creating a living metadata map that connects technical models and business context.
7. Filtering and Scoping the Graph
Lineage graphs can grow large quickly. To make them manageable:
- Filter by
layerordomain - Collapse entities with no relationships
- Generate subgraphs for each domain (e.g.,
Customer,Product,Order)
Example query:
SELECT *
FROM metadata.relationships
WHERE entity LIKE ‘Customer%’ OR target LIKE ‘Customer%’;
This lets you visualize lineage for a single business area — ideal for domain-driven design contexts.
8. Continuous Lineage Updates in CI/CD
Add lineage generation to your existing build pipeline:
python tools/generate_logical.py
python tools/generate_sql.py
python tools/load_to_duckdb.py
python tools/generate_lineage.py
After each commit, new YAMLs are parsed, metadata is reloaded into DuckDB, and lineage diagrams are refreshed automatically in your documentation portal.
This ensures that lineage is always synchronized with your metadata source of truth.
9. Example Use Cases
- Impact analysis: “If this concept changes, what downstream tables are affected?”
- Governance: Visualize ownership and stewardship per entity.
- Refactoring: Identify redundant entities or circular relationships.
- Education: Explain architecture to new team members visually.
Lineage turns metadata from static documentation into a navigable, interactive knowledge graph.
10. In Summary
With dynamic lineage visualization, your metadata becomes living architecture:
- Queryable with DuckDB
- Observable through quality metrics
- Explorable via interactive graphs
By combining structural metadata with visualization libraries, you bridge design and communication — creating a single, continuously updated view of your data landscape.
11. Next in the Series
“Integrating Metadata Lineage into Data Quality and Monitoring.”
We’ll show how to connect your lineage graph to DQ checks — linking data validation rules directly to the entities they protect.