Creating a Shared Space for Data Understanding and Co-Creation
Summary
In [[model-driven data engineering]], [[collaboration]] between business and technical teams often starts too late — after pipelines are built and logic is locked in.
The [[Collaborative Layer]] changes that: a controlled environment where data modelers and business users co-create [[mappings]], explore source data, review intermediate transformation results, and validate logic together using familiar tools like [[Power BI]].
It’s a bridge between [[data transparency]] and [[semantic understanding]], turning model development into a shared experience instead of a handoff process.
💡 Why We Need a Collaborative Layer
In most data engineering workflows, the pattern is predictable:
- Source data is ingested.
- Engineers build transformations.
- The business validates the final results — often too late in the process.
The result:
- Misunderstandings between business logic and technical implementation.
- Rework caused by misaligned mappings.
- Black-box transformations with little visibility.
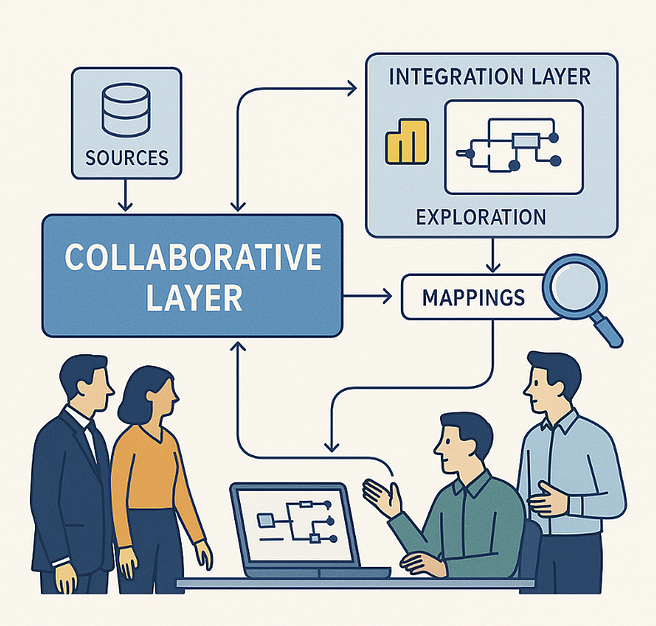
The Collaborative Layer bridges this gap — offering a [[metadata-driven workspace]] where data modelers and business users collaborate directly to explore, map, and validate data before it enters governed integration layers.
🧱 The Collaborative Layer Explained
The Collaborative Layer sits between the [[Source Layer]] and the [[Integration Layer]]. It’s not just another [[staging area]] — it’s a [[co-creation zone]].
Here, data modelers “cook” while the business can taste, observe, and suggest improvements — much like a test kitchen before serving the final dish.
The layer contains:
- Published Source Views — exposing raw and logical data subsets for transparency.
- [[Intermediate Transformation Results]] — making the step-by-step evolution of data visible.
- [[Profiling Metadata]] — automatically generated insights such as key candidates and [[data quality]].
- [[Business-Friendly Mapping]] Definitions — declarative, readable mapping logic.
This turns the data pipeline into a transparent narrative that both sides can understand and refine together.
🔍 Publishing Source Views for Transparency
Rather than hiding source data behind transformations, we publish it through metadata-driven views:
- [[Raw Source Views]] show data as it exists in the source.
- Logical [[Source Access Views]] show only the columns and tables relevant to specific use cases.
Each view is registered in metadata and automatically enriched with:
- Column statistics, null ratios, distinct values.
- Inferred primary and foreign keys using AI-based pattern recognition.
- Detected relationships and semantic alignments across datasets.
These insights transform exploration into understanding — creating [[traceability]], context, and clarity right from the start.
🧠 Seeing the Cooking Process
As mappings evolve, intermediate transformation results are deployed into the Collaborative Layer, showing how data progresses:
- Source View
- Cleaned or decoded dataset
- Joined and harmonized entities
- Candidate Integration Model
This visual transparency helps business users follow the logic, validate results, and provide input at the right time — before changes move into production.
🤝 Business in the Loop: The Cooking Metaphor
In our Business-Friendly Mapping Methodology, we emphasize that business logic should be readable and declarative.
The Collaborative Layer brings this to life:
- Business and modelers review mappings in natural language.
- They jointly inspect intermediate results.
- Mappings are stored and generated from metadata rather than written as isolated code.
The business isn’t just validating outcomes — it’s participating in shaping them.
🧮 Data Profiling and Discovery
To support this co-creation process, the Collaborative Layer performs automated data profiling:
- Detecting likely keys, relationships, and anomalies.
- Surfacing profiling statistics within the metadata repository.
- Enabling AI-assisted discovery of potential joins and reference sets.
These insights can be surfaced directly in VSCode, draw.io, or the metadata interface — empowering modelers and business users to perform guided data discovery without deep technical knowledge.
⚙️ Power BI as the Exploration Interface
A key advantage of the Collaborative Layer is its compatibility with Power BI and other BI tools. By exposing read-only SQL views, the layer becomes an ideal space for visual validation and exploration.
Business users can:
- Connect Power BI to the Collaborative Layer.
- Explore data and validate transformations visually.
- Create temporary dashboards to test logic and definitions.
For example:
Analysts can connect Power BI to the Collaborative Layer, open the “Customer Enrichment” view, and check whether the Preferred Channel mapping produces the expected outcome.
This transforms Power BI into a collaboration interface — not just for visualization, but for iterative validation of business logic.
🛡️ Governance and Lifecycle
While open for exploration, the Collaborative Layer remains fully governed:
- Access is role-based and metadata-controlled.
- Views are read-only and time-bound.
- Once validated, mappings are promoted automatically into the Integration Layer.
This ensures agility without sacrificing security, compliance, or auditability.
🔄 From Collaboration to Production
After validation:
- The approved transformations are auto-generated in the Integration Layer.
- Metadata and lineage remain intact.
- Observability tools (as in AI-Augmented Observability) monitor ongoing data behavior.
The Collaborative Layer thus becomes the front-end of our data lifecycle — closing the loop between see → reason → act → verify.
🌐 The Modern Data Architecture Stack
Sources → Source Views → Collaborative Layer → Integration Layer → Semantic Layer → Delivery
↘︎ Power BI (Exploration & Validation)
This architecture establishes a continuous collaboration loop where data engineers and business experts jointly build meaning — supported by automation, governance, and AI-driven insight.
🚀 Key Takeaways
- The Collaborative Layer is a shared workspace that unites data engineers and business users.
- Source Views and intermediate results make transformations transparent.
- Automated profiling and AI-assisted discovery accelerate understanding.
- Power BI connectivity enables visual validation and early feedback.
- Together, these capabilities evolve data engineering into a shared modeling experience built on trust and transparency.