How to detect inconsistencies and model drift using DuckDB and metadata-as-code
Summary
In the previous article, we loaded our YAML-based conceptual, logical, and physical models into DuckDB, turning them into a queryable metadata catalog. Now we’ll take it one step further: making that catalog observable.
Metadata observability means continuously monitoring the health, completeness, and evolution of your data models — much like data observability tools monitor pipelines and datasets.

1. Why Metadata Observability?
When your data models are managed as code, they evolve constantly.
Concepts change, new attributes appear, relationships are refactored, and sometimes — lineage is broken.
Without observability, these changes go unnoticed until something fails downstream:
- Missing
derived_fromlinks between layers - Entities with no primary key
- Attributes that lose atomicity
- Conceptual models not synchronized with logical ones
By adding observability checks, you create a feedback loop between model design, implementation, and governance.
2. Observability in the Metadata Pipeline
Let’s recap where we are in the metadata-driven stack:
Conceptual → Logical → Physical → Published → Cataloged → Observable
Each layer adds transparency. Now we add metrics and monitoring — helping ensure model quality stays consistent over time.
3. Defining Metadata Quality Metrics
We can define a few key dimensions of metadata quality:
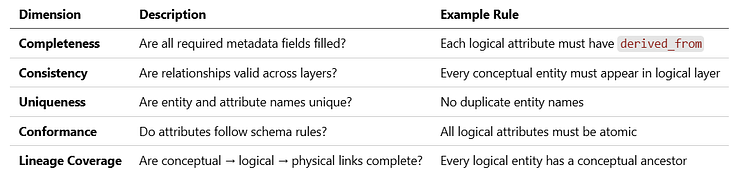
Each rule can be implemented as a DuckDB SQL check.
4. Setting Up the Metadata Checks in DuckDB
Below is a small “observability framework” in SQL.
– 1️⃣ Completeness: attributes missing derived_from
CREATE OR REPLACE TABLE checks_missing_lineage AS
SELECT entity, name
FROM metadata.attributes
WHERE derived_from IS NULL OR derived_from = ‘’;
– 2️⃣ Consistency: logical entities not linked to conceptual
CREATE OR REPLACE TABLE checks_unlinked_entities AS
SELECT entity
FROM metadata.entities
WHERE layer = ‘logical’
AND derived_from NOT LIKE ‘conceptual.%’;
– 3️⃣ Keys: entities missing a primary key attribute
CREATE OR REPLACE TABLE checks_missing_keys AS
SELECT e.entity
FROM metadata.entities e
LEFT JOIN metadata.attributes a ON e.entity = a.entity AND a.name ILIKE ‘%id%’
WHERE a.entity IS NULL;
– 4️⃣ Completeness summary
SELECT
(SELECT COUNT() FROM metadata.entities) AS total_entities,
(SELECT COUNT() FROM checks_missing_lineage) AS missing_lineage,
(SELECT COUNT() FROM checks_unlinked_entities) AS unlinked,
(SELECT COUNT() FROM checks_missing_keys) AS missing_keys;
These checks create “error tables” that can be queried or visualized later.
5. Tracking Changes Over Time
To make observability temporal, we can snapshot metadata periodically.
CREATE TABLE IF NOT EXISTS metadata_snapshots AS
SELECT CURRENT_TIMESTAMP AS snapshot_time, * FROM metadata.entities;
Then compare snapshots:
SELECT a.entity, a.layer
FROM metadata_snapshots a
LEFT JOIN metadata_snapshots b
ON a.entity = b.entity AND b.snapshot_time < a.snapshot_time
WHERE b.entity IS NULL;
This highlights new or deleted entities — a simple form of metadata drift detection.
6. Visualizing Observability Metrics
You can easily visualize metadata metrics using DuckDB’s integrations or BI tools.
Example dashboard metrics:
✅ % of entities with valid lineage
🔑 % with primary keys defined
🔗 % of attributes with derived_from
🔄 entities added/removed since last commit
Store these metrics in a summary table:
CREATE OR REPLACE TABLE metadata_quality AS
SELECT
CURRENT_TIMESTAMP AS measured_at,
(SELECT COUNT() FROM metadata.entities) AS total_entities,
(SELECT COUNT() FROM checks_missing_lineage) AS missing_lineage,
(SELECT COUNT() FROM checks_missing_keys) AS missing_keys,
(SELECT COUNT() FROM checks_unlinked_entities) AS unlinked_entities;
Then visualize trends over time.
7. Integrating Checks in CI/CD
Because all checks are SQL, you can integrate them directly into your build pipeline.
duckdb data/metadata_catalog.duckdb < tools/check_metadata.sql
If any query returns results, the pipeline fails — enforcing quality gates just like linting or schema tests in dbt.
Example integration:
if duckdb data/metadata_catalog.duckdb < tools/check_metadata.sql | grep -q “missing_lineage”; then
echo “❌ Metadata lineage check failed!”
exit 1
fi
This ensures that all YAML changes meet structural and lineage standards before merging.
8. Example Observability Dashboard
In Notion or Confluence, you can embed these metrics dynamically:
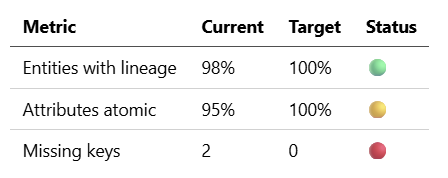
The dashboard updates automatically as part of your publishing workflow.
9. Why This Matters
Metadata observability brings engineering discipline to modeling:
- Feedback Loop: Detect issues early, before deployment.
- Trust: Stakeholders can rely on accurate lineage.
- Scalability: Governance scales without manual audits.
- Continuous Improvement: Metrics guide cleanup and refactoring.
As Alec Sharp might put it: you’re not just modeling the business — you’re monitoring how well that model stays true to the business over time.
10. In Summary
We’ve now made our modeling process self-aware:
1️⃣ YAML → conceptual, logical, physical
2️⃣ Published to Notion / Confluence
3️⃣ Indexed in DuckDB
4️⃣ Monitored with SQL-based observability
By tracking lineage, structure, and evolution, we’ve turned metadata into a governed, measurable asset — one that improves with every commit.
11. Next in the Series
“Dynamic Metadata Lineage: Building Interactive Visuals of Model Relationships.”
We’ll use the metadata catalog to generate interactive lineage graphs and cross-model dependency maps — bringing your metadata to life visually.