How to unify reproducible historization, governed deduplication, and data quality observability into one metadata-driven framework.
🧩 Part of the Model-Driven Data Quality series — exploring reproducible, metadata-driven patterns for historization, deduplication, and bi-temporal data management.
Introduction
In previous articles, we looked at two critical components of reproducible data pipelines:
- Historizing Source Tables Without a Primary Key — how to build bi-temporal SCD2 tables based on deterministic hash identities.
- Correct, Governed Deduplication in SQL (Without Breaking Your Pipelines) — how to detect, flag, and quarantine duplicates without halting delivery.
Both patterns solve distinct problems:
- Historization preserves all records exactly as they were delivered.
- Deduplication interprets which of those records represent valid business instances.
But the real value comes when we bring them together — into a single metadata-driven framework that also powers data quality dashboards and observability metrics across your data platform.
Three Layers of Trust
We can think of the architecture as three concentric layers:
Historization — guarantees technical reproducibility and temporal completeness.
- Every record is loaded as-is, identified by a technical hash.
- No information is lost.
- Bi-temporal validity allows us to reconstruct the dataset at any point in time.
Governed Deduplication — ensures semantic consistency.
- Detects and flags duplicates using logical primary key expressions.
- Assigns clear, deterministic statuses like
OK,OK_PRIMARY, andDQ_DUPLICATE. - Keeps pipelines running while surfacing quality issues transparently.
DQ Observability — creates operational visibility and accountability.
- Aggregates DQ metrics per table, batch, or domain.
- Tracks trends (e.g., duplicate ratio, missing key count).
- Exposes dashboards for monitoring and root-cause analysis.
Together, they form the foundation for a self-observing data platform.
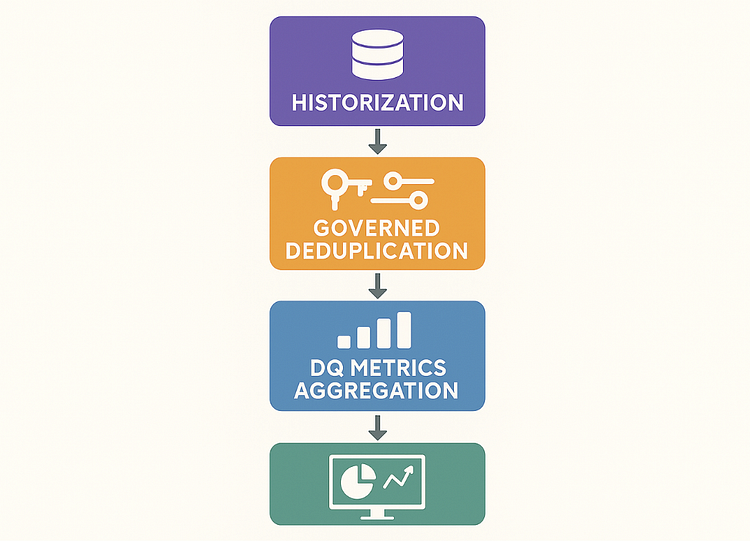
From Historization to Observability: The Flow
Here’s how the pieces fit:
Source System
↓
Historization (bi-temporal, hash-based)
↓
Governed Deduplication (logical keys, row-level flags)
↓
DQ Metrics Aggregation (summaries, trends, alerts)
↓
DQ Dashboard / Data Product Layer
Each layer enriches the data with additional metadata rather than modifying or hiding it.
Example lineage
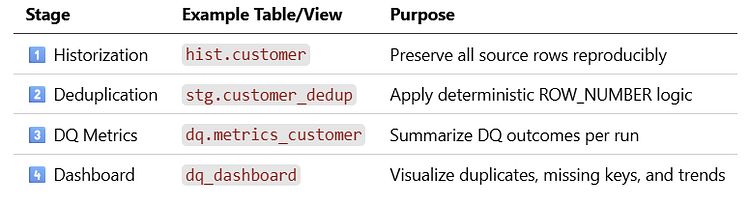
Instead of hardcoding logic, we declare the semantics once — in metadata.
A simplified YAML pattern might look like:
historization:
business_hash:
algo: sha256
columns: [“col1”, “col2”, “col3”]
identity:
key_template: “${business_hash}:${dup_rn|pad=8}”
deduplication:
key_expression: “CASE WHEN type=’A’ THEN concat(id, date) ELSE concat(id, date, scenario) END”
order_by: [“created_at DESC”, “ingested_at DESC”, “row_hash”]
dq_labels:
OK: “Unique record”
OK_PRIMARY: “Winner in duplicate set”
DQ_DUPLICATE: “Duplicate record detected”
observability:
metrics:
– name: duplicate_ratio
expression: “sum(case when dq_status=’DQ_DUPLICATE’ then 1 else 0 end)/count()”
– name: null_key_ratio
expression: “sum(case when key_expression is null then 1 else 0 end)/count()”
dimensions: [“batch_id”, “source_system”]
thresholds:
duplicate_ratio: 0.02
This single metadata definition drives:
- SQL generation for historization, deduplication, and DQ tables.
- Consistency between operational and analytical metrics.
- Observability dashboards that stay aligned as models evolve.
Example DQ Dashboard
A typical dashboard built on top of this framework shows:
KPIs
- Total records loaded
- % duplicates
- % null business keys
- Trend over last 30 days
Slices
- By
source_system - By
batch_id - By
domainordata_type
Drill-down
- View duplicate groups (showing winner + losers)
- View affected business keys and reasons
Alerts
- Trigger when duplicate ratio exceeds threshold
- Notify when new logical PK violations appear
This turns previously hidden data quality patterns into visible, measurable, and actionable signals.
The Feedback Loop
The most powerful aspect of this design is the closed feedback loop:
- Historization makes data reproducible.
- Deduplication makes data interpretable.
- Observability makes quality measurable.
- Metrics feed back into governance and source remediation.
Instead of relying on manual data audits, the system itself exposes when and where quality degrades — while continuing to process and preserve all incoming data.
Implementation Notes
- Works natively across Databricks, Snowflake, BigQuery, and Postgres — using standard SQL constructs (
ROW_NUMBER,COUNT,QUALIFY). - Integrates seamlessly with dbt, Airflow, or any orchestration framework.
- Scales horizontally: metadata definitions drive code generation for hundreds of tables.
- Supports DQ traceability: row-level DQ status and reason flow downstream to semantic models and BI dashboards.
Closing Thoughts
The real power of a modern data platform lies not in perfect data, but in transparent data — where every record’s quality, lineage, and interpretation are traceable through metadata.
By uniting historization, deduplication, and data quality observability, we move from reactive data cleansing to proactive, self-documenting data governance.
Historization preserves.
Deduplication interprets.
Observability explains.
Together, they make data trustworthy — and trust is the foundation of every reliable data product.
🔗 Related Reading
- Historizing Source Tables Without a Primary Key
Reproducible bi-temporal SCD2 using hash-based technical keys. - Correct, Governed Deduplication in SQL (Without Breaking Your Pipelines)
Deterministic row-level DQ pattern for duplicate handling. - Historizing Data with Conditional Primary Keys
Handling mixed datasets where logical PKs differ per subtype.